Digital Vegetation Signature™

Go Digital with LandScan

What is the Digital Vegetation Signature (DVS)?

There is more to airborne remote sensing than meets the eye. Unlike satellite data, imagery collected with airplanes or drones is not calibrated. Most providers will say they calibrate their airborne spectral imagery, but it is not calibrated at the pixel-scale which is important in order to generate analytical quality data in space and time. In addition to high-resolution spectral calibration, LandScan has added a thermal and a hyper-spatial calibration process.

The DVS is analytical quality airborne imagery that provides incredible digital detail. Every plant is unique!

The Digital Vegetation Signature (DVS) technology can distinguish any two plants from one another and generate rapid, unique digital classifications based on spectral, thermal, and hyper-spatial characteristics. The DVS is generated using a system of software, hardware, and analytics and can be applied to both drone and airplane sensing platforms. The DVS is analytical quality remote sensing.


Why does calibration matter?

What isn’t well-calibrated can’t be quantified with accuracy or certainty. This is particularly so when analyzing crop performance over time. Do not be fooled by airborne imagery describing cumulative conditions like water or nutrient stress which are not produced with imagery calibrated at the pixel scale; the noise and uncertainty will accumulate with time.


Hyper-Spatial

One of the most important benefits of remote sensing calibration is that it enables LandScan to deploy the DVS over large areas. LandScan deployed a drone-based LIDAR sensor in-line (same day) with our hyper-spatial analytics to enable comparison of the two. The DVS sensor covers 10x more ground but is able to deliver a similar level of 3D resolution. This data provides a rapid, objective and repeatable measure of plant performance and behavior.


Spectral Calibration

The DVS removes bad pixels and accentuates the quality ones.

Calibration enables the study of individual plants and their immediate surrounding as individual objects for analytical purposes. This image shows how the DVS product can be tuned to filter out vegetation within a certain height of the ground, thus prohibiting cover crop from contaminating the analysis of the tree. Another filter removes the dead branches while yet another selects only sunlit pixels, so that all pixels used to characterize the tree are consistently lighted and thus comparable over time (still other DVS calibrations account for changes in atmospheric conditions).


There are dozens of such algorithms in the DVS software. All of this is only possible because the DVS data is analytical quality. Only with calibrated data can you perform temporal analytics.


Temporal Data Analysis (thermal example)

This example shows the dynamic thermal profile of two trees in the same field using the DVS high-resolution thermal sensor with a spatial resolution of 15cm. The two trees are not distinguishable from each other in March or June, but their differences are obvious in April and August. One is smaller and has a more irregular canopy that produces more light fluctuations within the canopy. These trees and others with similar profiles can be further investigated to determine if there is a water and/or nutrient relationship between these classes. Does one produce a different quality or quantity of crop?


Making use of temporal data

The ability to extract analytical quality temporal data related to vegetation turbo-charges artificial intelligence as new data dimensions become available. Not only does this additional type of data help distinguish and characterize vegetation, but it also provides agronomic clues that will lead to smarter decisions around planting, managing, and harvesting.


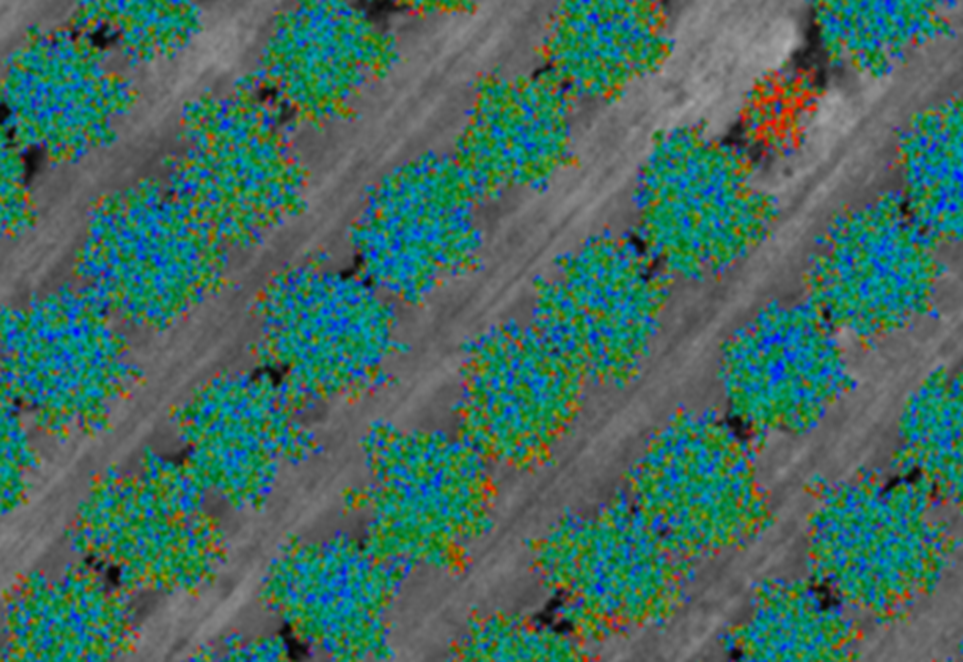
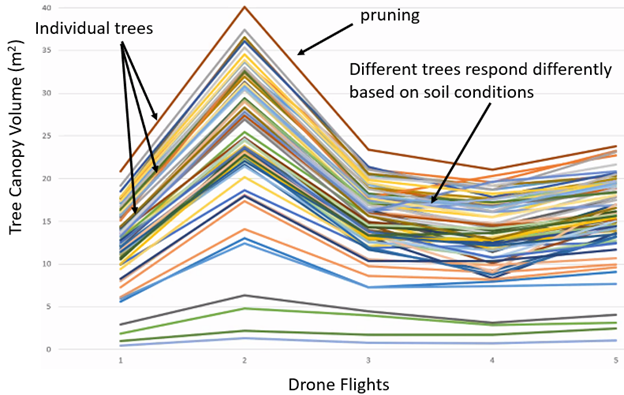
Our proprietary data-driven calibrations enable LandScan to turn mere data into insights about each plant and in turn can help guide future analytics, decision making, and actions. Data need not always be mapped to understand its value. In this example we see the canopy volume of lemon trees as measured using the DVS hyper-spatial function. The distribution of canopy size is ‘normal’, exhibiting a few very large and very small canopies, with most somewhere in the middle.

For the first 2 drone flights, the canopy volumes were growing at a steady and uniform rate. Before the 3rd drone flight, the trees were uniformly pruned and this can be observed. However, notice how after the pruning, the canopy volume of some trees begins to increase again while others remain constant, and still others show a decline. LandScan has the unique ability to observe these differences, and then objectively diagnose the soil conditions in which each of these three categories of trees is growing. This information can guide future precision pruning applications.


DVS Information Products

LandScan distributes and publishes our data to our users via a cloud-based interface called the Datum Dashboard.

Datum Dashboard (demo)

Make Contact

Let's start a conversation

Book Services

Book Service for fall 2024 and 2025

We are currently booking services for fall 2024 and 2025.  

  • No payment required until 60 days prior to scheduled work.
  • Cancel anytime until down payment is made.
  • Once your reservation is placed, our team of experts will contact you to develop a work plan and cost estimate and then schedule your services.