Root Cause Analytics™
Learn From Every Plant
Root Cause Analytics (RCA)
Insights for Digital Agronomy
- Variable Rate Fertility Programs
- Irrigation Design Tools and Optimizations
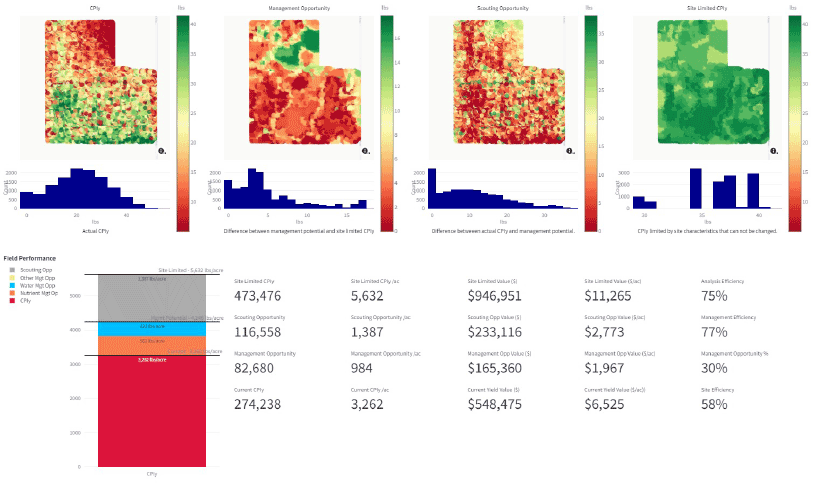
- Field Performance and ROI
- Estimated Performance Potentials
- Top Factor Effecting Performance
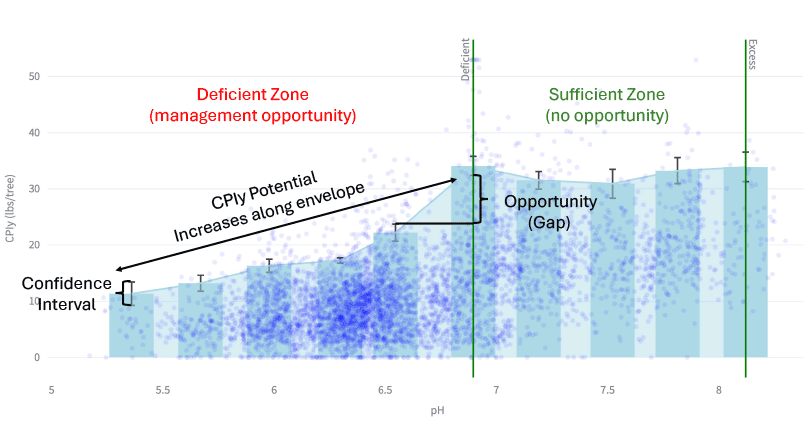
- Sufficiency Charts for Each Factor
- Balancing Production and Sustainability Goals
- Sensor Placement
- Scouting and Sampling Targets
- Zoning and Grouping

Learn to Optimize for ROI
+ $
0
/ac
Irrigation Optimization
+ $
50
/ac
Fertilizer Amendments
+ $
150
/ac
Yield/Quality Improvements
+ $
0
/ac
Stewardship and GHG Reduction
on an annual basis
Case Study
How We Learn From Every Plant
We Measure
Soils and Vegetation
Using the DSC and DVS, we measure:
- Canopy Biomass and Health
- Ground Cover and Biomass
- Topography
- Soil Variability
- Soil Health Properties
- Soil Fertility Properties
- Soil Physical and Water Properties
We Integrate
With Your Data
The Digital Twin and GEMS analysis can incorporate:
- Block and Planting Layouts
- Cultivar and Root Stocks
- Scouting and Agronomic Data
- As-applied Irrigation and Fertilizers
- Leaf Tissue Analysis
- Weather and Climate Data
- In-field Sensors (e.g. Soil Moisture, Pest Traps)
We Build
Digital Twins
When we build your Digital Twin, we install the Information Infrastructure required to model and analyze the performance of every plant through time.

We Discover
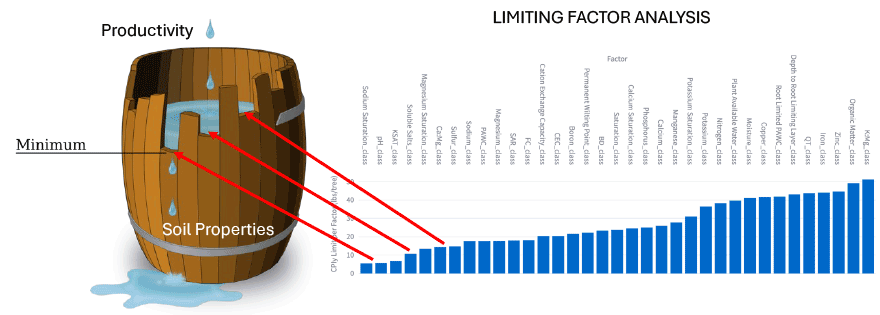
Limiting Factors & Opportunities
Our unique analytical methods are based on a century-old theory that productivity is not dictated by the total resources available but by the limiting resource. The Root Cause is found on the Edges.


We Formulate
A GEMS Analysis
PPB = f(G,E,M,S)
Where:
- PPB is Plant Performance and Behavior (Yield, Quality)
- G is Genetics Factors (Cultivar, Rootstock)
- E is Environmental Factors (Soils, Terrain, Climate)
- M is Management Factors (Nutrient and Water Applications)
- S is Socioeconomic Factors (GHG, Sustainability)
Most importantly, the function f is derived from the Limiting Factors.
We Power
Digital Agronomy
- Variable Rate Fertility Programs
- Irrigation Design Tools and Optimizations
- Field Performance and ROI
- Estimated Performance Potentials
- Top Factor Effecting Performance
- Sufficiency Charts for Each Factor
- Balancing Production and Sustainability Goals
- Sensor Placement
- Scouting and Sampling Targets
- Zoning and Grouping
