“LandScan’s Root Cause Analytics integrated with our variable‑rate application systems have significantly improved the precision of our input management. By quantifying soil and environmental variability across space and time, we’ve reduced input costs, improved agronomist efficiency, and realized measurable production gains. These combined benefits have yielded an average value of $390 per acre.”
Zac Ellis – Senior Director, Agronomy at olam food ingredients – ofi (Olam)
Net Benefit: $260/acre
Using An Agriculture Digital Twin for GEM-Informed Management
Executive Summary
Today, many otherwise progressive growers and managers of high value crops find themselves with uneven yields and more expensive inputs and are asking what they can do to improve uniformity, reduce risk and take their operations to the next level of profitability and sustainability.
Historically, agricultural improvement has focused heavily on genetics and management, while ignoring in-field variations in the environment. With the adoption of GPS and yield monitoring technologies, particularly in row crops, interest in the cause of yield variation and precision management has grown over the past two decades.
First articulated around 2003, the GEM framework (GEM: Genetics × Environment × Management) was adopted by John Deere Agri Services and presented to a broader audience by its president, Lynn White, at IFAMA 2006, after which it began to permeate the academic literature. Until now, GEM has mostly found application in the search for better cultivars with an emphasis on climate and weather as the principal environment variables in row crops.
LandScan reframes this approach by making environmental variability explicit and measurable via the Digital Soil Core (DSC™) and making plant performance measurable via the Digital Vegetation Signature (DVS™), allowing management decisions to be aligned with actual field conditions rather than assumptions.
GEM (Genetics × Environment × Management) is a practical framework for understanding—and improving—crop performance as a system, not a set of isolated inputs.
At its core, GEM recognizes that agricultural outcomes are driven by the interaction of three factors:
· Genetics (G): The inherent yield and quality potential of the cultivar or hybrid
· Environment (E): The physical and climatic context in which the crop grows—most critically soil properties, rooting conditions, and water dynamics
· Management (M): The operational decisions applied to the system, including irrigation, fertility, amendments, and cultural practices
Performance is not determined by any one of these factors alone. It emerges from how well they are matched and managed together, in space and over time.
· Genetics defines what could be achieved.
· Environment determines where that potential is reachable.
· Management controls how much of that potential is realized—and at what cost.
At LandScan, our focus within the GEM framework has always been on maximizing the management benefit that flows from precise characterization of the spatial variability of soils and vegetation. Through our unique Digital Twin technology and the Root Cause Analytics (RCA™) platform, LandScan operationalizes GEM, using high-resolution vegetative and soil data to identify limiting factors, quantify management opportunity, and optimize ROI. In this paper, we introduce the GEM framework and Digital Twin with a real-world case study illustrating how LandScan’s RCA™ platform converts limiting factor theory into targeted intervention with measurable outcomes.
GEM as a Management and Investment Lens
Applied correctly, GEM is not about chasing maximum yield everywhere. It is about allocating resources intelligently: investing where the environment allows a response, reducing where there is excess, and managing what is controllable within the constraints of the landscape.
For asset managers and ag business leaders, GEM provides a common language to connect biology, operations, and economics—turning field variability from a source of uncertainty into a structured opportunity to increase value and reduce risk.
From Framework to Field: Operationalizing GEM via Digital Twins
LandScan’s technology stack brings the GEM framework into precision agriculture through a tightly integrated system:
DVS + DSC = LandScan’s Digital Twin
RCA = LandScan’s GEM Engine
- DVS™ (Digital Vegetation Signature): Ultra-high-resolution 3D multispectral crop canopy data from UAV and satellite-based sensors.
- DSC™ (Digital Soil Core): Patented multi-sensor soil profiling probe and geophysical survey that quickly maps 3D soil properties to 3+ feet (1 m) depth at 1-cm vertical resolution.
- RCA™ (Root Cause Analytics): A GEM-informed engine that identifies site and management limiting factors, quantifies opportunity, and identifies data-driven interventions.
The result is a plant-level digital twin with enough fidelity to track productivity over time, quantify the effects of G, E, and M, and isolate the true limiting factors constraining ROI.
Root Cause Analytics (RCA™): The GEM Engine
RCA™ is LandScan’s patent-pending, applied decision intelligence engine, performing limiting factor analysis with respect to a broad suite of environment, genetics, and management parameters, including soil properties considered in vertical profile and localized to each plant in a field. RCA™ enables:
· Frontier-Based Crop Response Modeling: Identifies the sufficiency zone, deficiency, and excess thresholds for each measurable property (e.g. potassium, pH, calcium, carbon, etc.) for each variety and rootstock.
· Separating Management Opportunity from Site Limitation: Determines whether underperformance can be corrected by adjusting inputs, or whether it depends on immutable factors (soil texture, terrain).
· ROI-Targeted Prescriptions: Identifies and quantifies opportunity gaps for each plant and generates variable rate intervention maps.
· Scouting Opportunity Mapping: Flags spatial patterns of unexplained underperformance for further investigation (e.g., irrigation uniformity issues, disease, field edge effects).
RCA™ transforms spatial variability from a problem into a diagnostic tool. Within RCA™, visualizations such as maps, response curves, and nutrient buckets support intuitive interpretation by agronomists and operators alike.
In RCA™ we formulate a GEM analysis as:
[PPB, s] = f(G,E,M)
Where, PPB is Plant Performance and Behavior (Yield, Quality) is a function of:
· G is Genetics Factors (Cultivar, Rootstock)
· E is Environmental Factors (Soils, Terrain, Climate)
· M is Management Factors (Nutrient and Water Applications)
And,
· s is Socioeconomic Factors (GHG, Sustainability)
The function f is bounded by limiting factors and is constructed by adapting frontier analysis from econometrics. This defines a data-driven crop response curve for each factor as a function of depth, as shown below.
Crop Response Curve, Sufficiency Zones, and Management Opportunity from Limiting Factor Analysis in LandScan’s RCA™
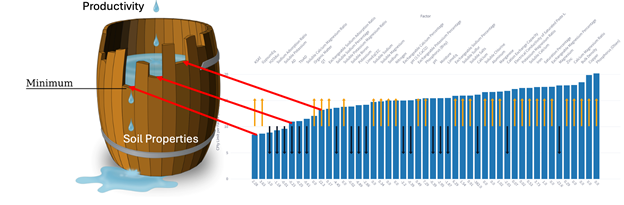
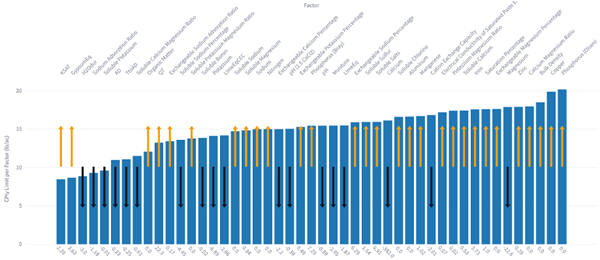
Leibig introduced a barrel and stave analogy to the describe the concept of limiting factors. As illustrated in the diagram below, the barrel can only be filled to the top of the shortest stave. RCA™ produces a chart for each plant that corresponds to a parallel arrangement of the staves as vertical bars sorted by height. From this, we identify management opportunity, the site-limiting factors, and scouting opportunity. Some factors are physically interrelated, so that adjusting one will affect another. But independent factors must be mitigated in a specific order from left to right.
Barrel and Stave Analogy to Limiting Factor Analysis
RCA’s GEM analysis produces four critical maps:
Crop Productivity Index (CPIy ) – current productivity potential, scaled to units of yield.
Management Opportunity – the potential response to changes in management factors.
Scouting Opportunity – how much the crop is underperforming what it should even under ideal management.
Site Limiting CPIy – the degree of crop underperformance attributable to unmanageable site limiting factors; and opportunity for savings.
Case Study: Optimizing Gypsum Amendment in an Almond Orchard
Problem: In a 50-acre almond block, owned by ofi, near Bakersfield, CA, a portion of the southeastern quarter of the block exhibits high replant rate and low vigor. This section of the block was also noted for poor infiltration compared to other parts of the field.
Diagnosis: RCA™ identified localized soil chemical hardpan conditions including excess sodium, insufficient soluble calcium, and elevated SAR. These conditions were linked to higher water holding capacity and lower hydraulic conductivity compared to the rest of the block due to more finely textured soils. This zone showed a higher accumulation of sodium in finer textured soils.
In this case study, the top five factors affecting productivity are ranked by opportunity, including soluble sodium and calcium (which can affect the flow of water in the profile).
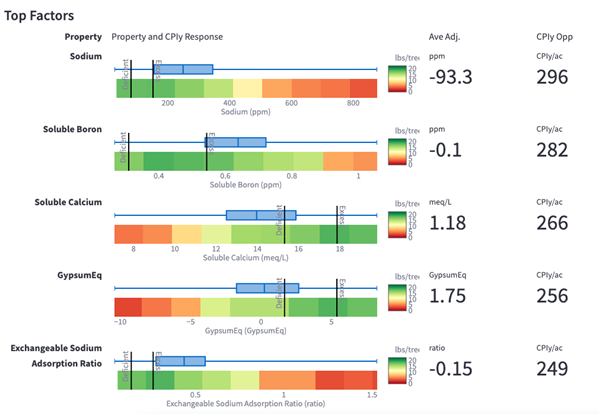
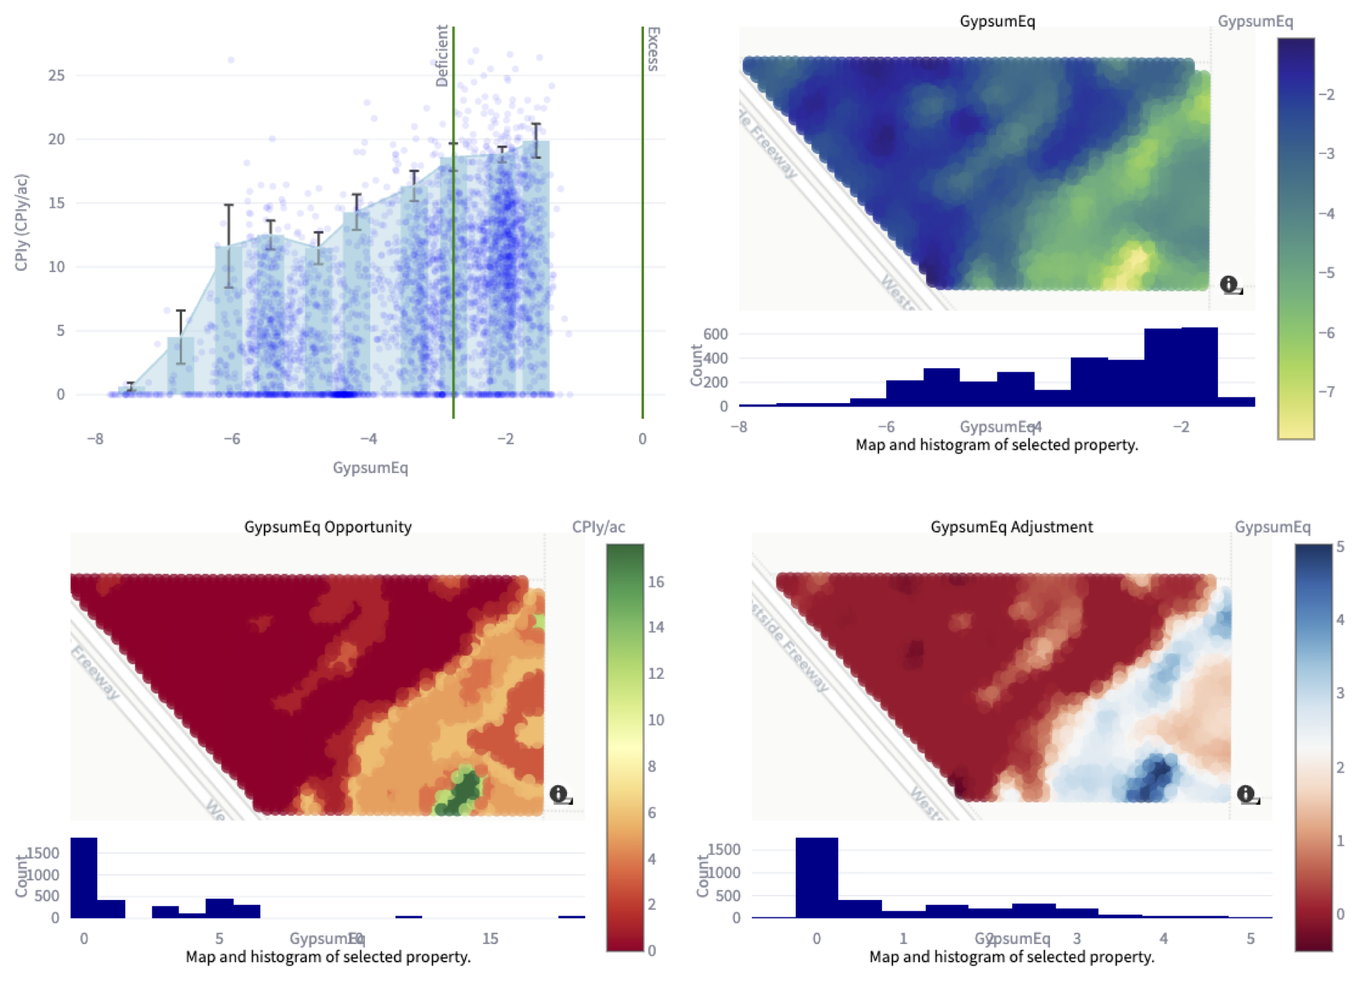
The RCA™ diagrams below show (for each of three parameters): the crop response curve, the map of the property, map of the management opportunity, and the ideal adjustment per tree. Every map also has a histogram to show the distribution.
As the diagrams indicate, the southeastern part of the field was found to need more soluble calcium and less soluble sodium.

Expressing the sodium adsorption ratio in terms of gypsum equivalence, the graph and maps show that the southeast corner of the field with low gypsum equivalence would be highly responsive to adding gypsum (gypsum opportunity) whereas much of the remaining field would not.

Recommendations: RCA™ analysis calculated gypsum demand in the nutrient application program. As is logical, it recommends a higher rate of gypsum in the southeast corner to correct Ca insufficiency and increase infiltration. Much lower rates are recommended elsewhere, thus providing significant material savings over uniform application while addressing the most acute need in the field.
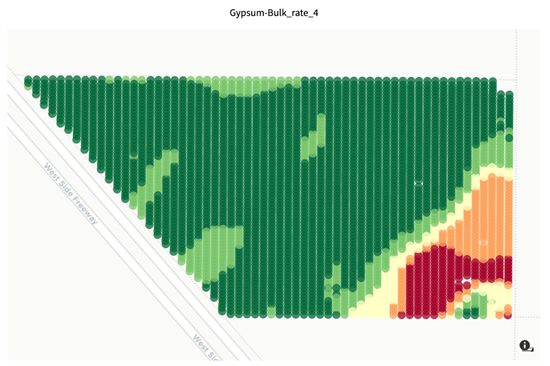
Results: The gypsum application prescription variably targeted only 23% of the block, reducing amendment costs by over 60% versus uniform application, providing immediate cost savings of $280/acre over a standard rate of 2 tons/acre. DSC™ mapping in the subsequent year shows a decreased need for Gypsum over most of that same area, demonstrating the effectiveness of the application and an improvement in soil quality. Additional ROI came from quantifiable improvements in yield.
Furthermore, top factors affecting production in 2025 shifted to less limiting adjustments: Magnesium and Potassium vs. Calcium instead of Sodium vs. Calcium and variable irrigation related properties (AD = Allowable Depletion, TtoAD = Time to Allowable Depletion, and KSAT = Saturated Hydraulic Conductivity), under single zone irrigation strategy, where the finer texture soils (higher AD, lower KSAT) continue to perform worse where they are over water compared to the parts of the field with coarser textured soil (lower AD, higher KSAT).
Strategic Implications
LandScan’s Digital Twin and GEM platform is not just a sensor product, crop surveillance, or a soil mapping service—it’s a decision intelligence system. For those seeking differentiated agronomic services, nutrient and water stewardship, or scalable ROI-driven agronomic insights, the platform offers:
- Proven capability to execute GEM at field and ranch scales
- A scalable architecture built for multi-field, multi-crop operations
- Quantifiable ROI from targeted management interventions
LandScan Digital Twin and GEM analytics are ready to integrate into the digital farming platforms you use today, like John Deere Ops Center, Climate FieldView, or AgWorld.
This article was written by Woody Wallace and Stephen Farrington of LandScan.
